


Objective information thanks to satellite imagery
-
For the production of a Site Similarity Certification (SSC) Spatial Business Integration utilises purpose-processed satellite images showing the vegetation condition in the observed cultivation areas world-wide.
The following satellite image information used within SSC will be presented: -
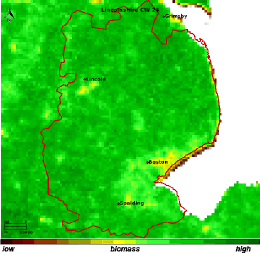 Satellite image of vegetation state cw24 Lincolnshire, UK
Satellite images of the vegetation condition
The particular advantage of satellite remote sensing is that each single cultivation area across the world is monitored with the same objective measurement method. Information from satellite imagery is therefore standardised and comparable.
Besides, the continuous daily recording of each single area guaranties a non-stop monitoring of vegetation growth in very short time-cycles. Consequently, this measurement method particularly lends itself to the highly dynamic development of crops.
Watch the development of the vegetation in our satellite image gallery.
-
 Satellite image of vegetation index in June
Vegetation index
Red and near-infrared bands are used for deriving the information made available on the satellite images. The spectral reflection of plants measured within these bands has been proven to depend on the produced plant biomass and its vitality, more particularly on its chlorophyll and water content.
This spectral information used go far beyond the perception of the human eye.
The numeric normalised transformation of the reflection values for the purpose of vegetation monitoring is called vegetation index.
Satellite images are composed of a multitude of pixels, each single pixel representing one vegetation index value. These values and its seasonal changes are associated with the vegetation characteristics and therefore representative for a site.
-
About space and time resolution
On the satellite image each pixel represents 1 km * 1 km and provides an information composed of the characteristics of those crops which cover the biggest area in the monitored site. Thus, in cereal growing areas cereal crops will dominate the multi-spectral satellite data whose growth state it will then display.
SSC satellite images are processed weekly or in a 10-days cycle. In order to minimise the surface ratio of potential cloud covering, each satellite image is composed of the daily images of the respective period. Weekly and 10-days satellite images enable sufficient information of the specific growth phases of the observed crops.


